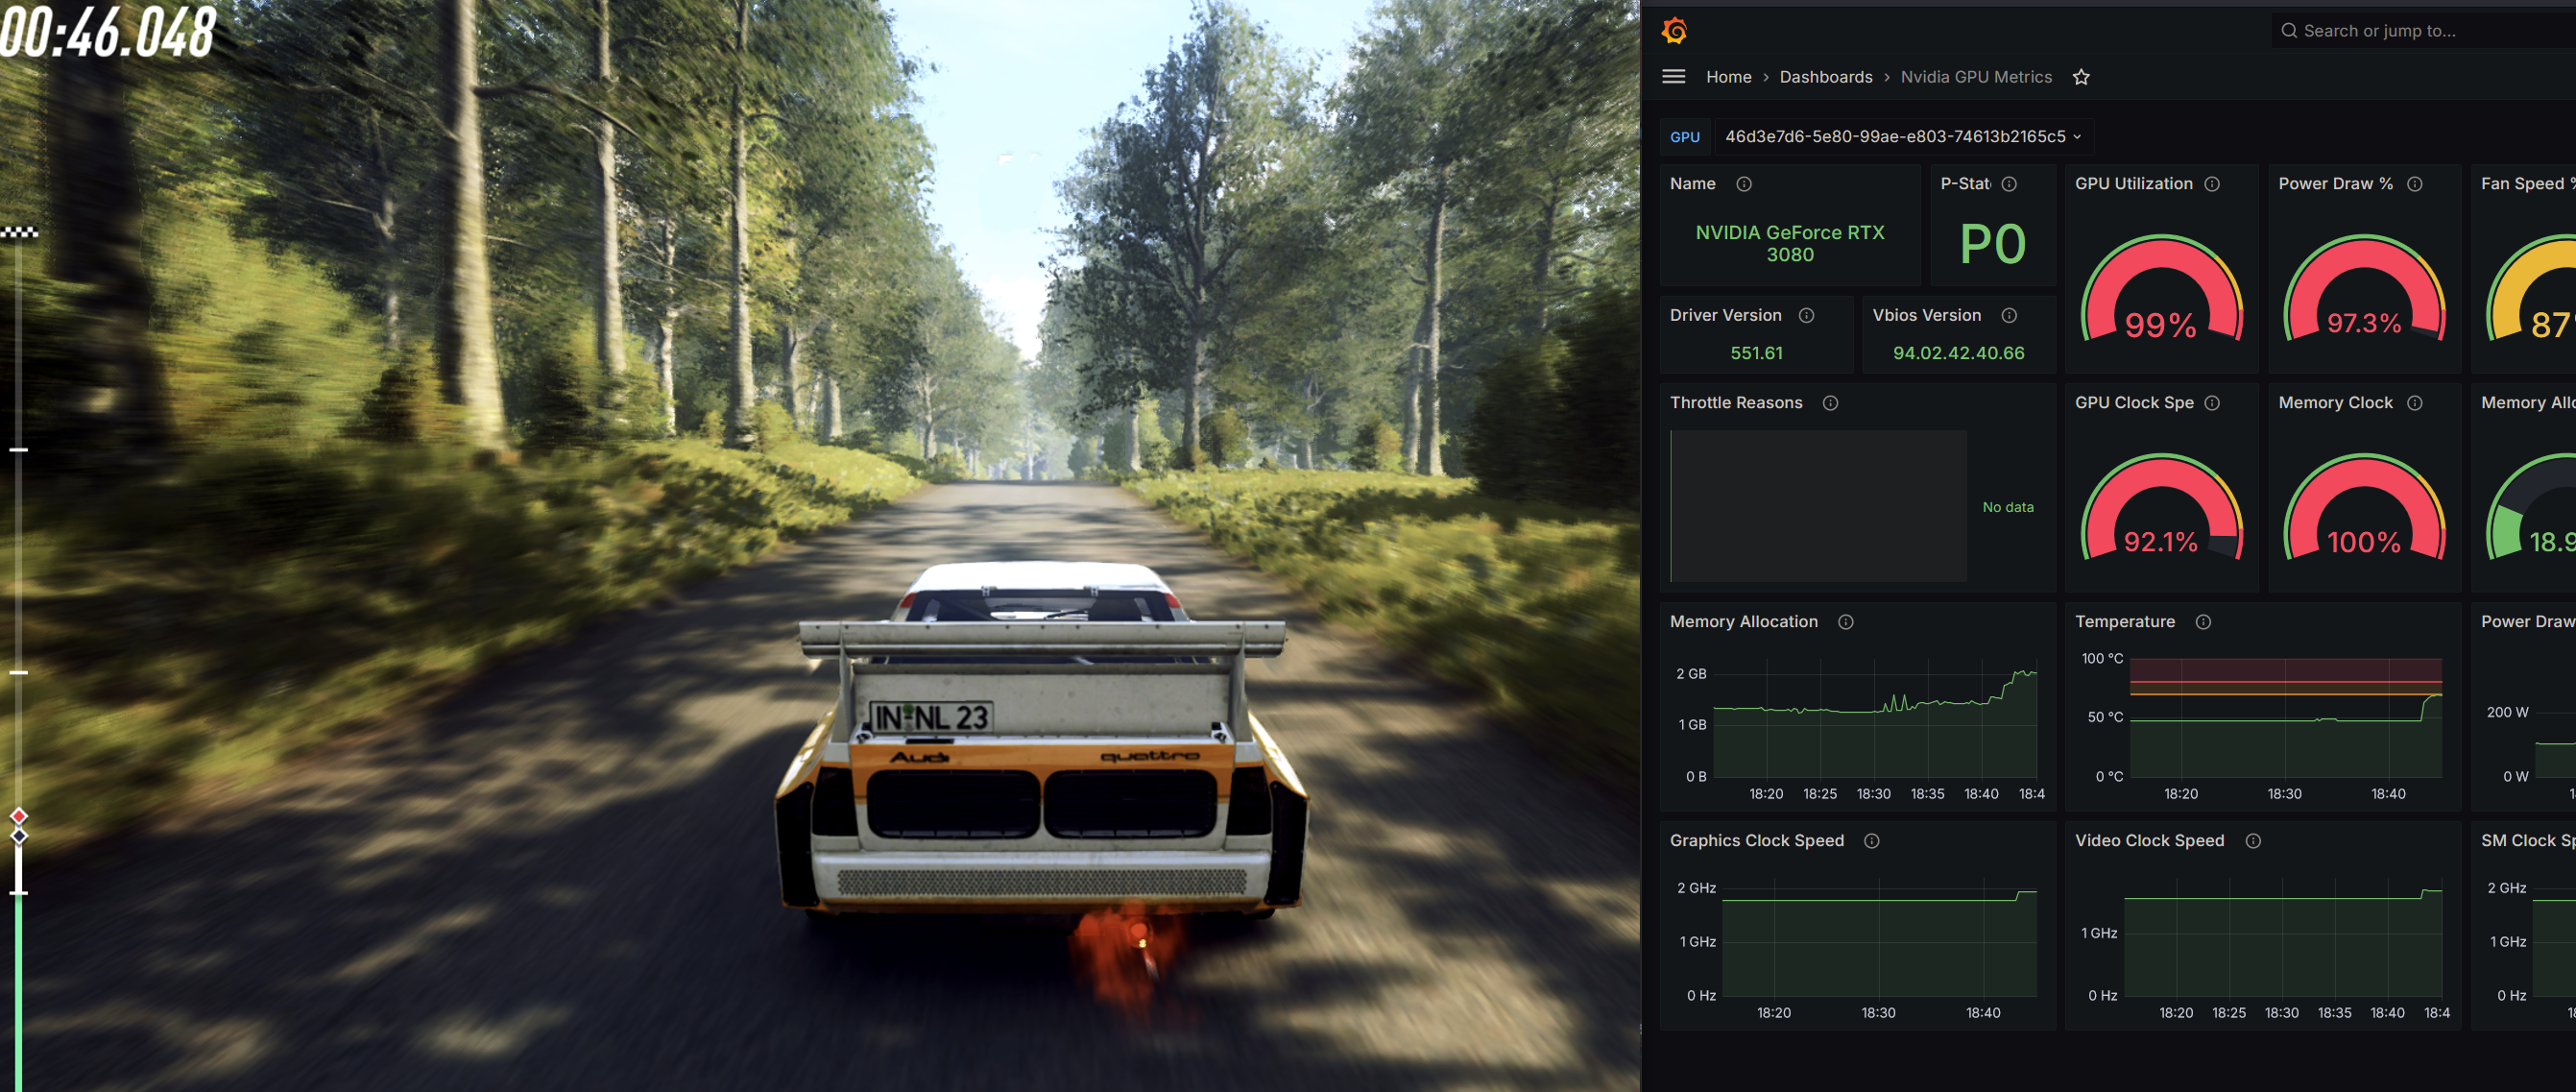
Monitor your gaming PC with Grafana
Last updated:
I recently discovered 2 excellent exporters for Windows, which allow you to monitor your PC whenever it’s turned on. This assumes your PC is running Windows and has a nvidia GPU. It assumes you already are running prometheus + grafana, or at least know how to set them up.
The 2 exporters are:
Setup Nvidia GPU Exporter
- Download the latest nvidia_gpu_exporter binary and extract it: nvidia_gpu_exporter/releases
- Additionally download Non-Sucking-Service-Manager which we’ll use to setup the exporter binary as a startup service.
- Test the gpu exporter by opening
nvidia_gpu_exporter.exe, it should show that it’s listening on a port and serving the exporter. You can also check it out at<your pc hostname>:9835/metrics. If it’s working, we’re ready to convert it into a service. - After downloading
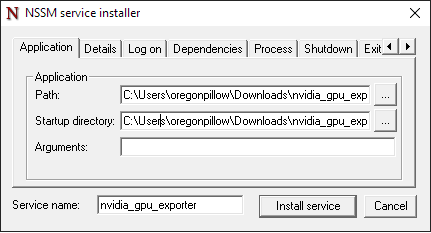
nssm, navigate to the application folder using the command line and execute:nssm.exe install nvidia_gpu_exporter
For example:
C:\Users\oregonpillow\Downloads\nssm-2.24-103-gdee49fc\nssm-2.24-103-gdee49fc\win64>nssm.exe install nvidia_gpu_exporter
This will open the GUI, simply select the nvidia_gpu_exporter.exe in the Path option, and the Startup directory will be auto-filled. Select Install service and you’re all set.

Sample Promethesus config:
- job_name: nvidia_exporter
    honor_timestamps: true
    scrape_interval: 15s
    scrape_timeout: 10s
    metrics_path: /metrics
    scheme: http
    follow_redirects: true
    static_configs:
      - targets: ["<your PC hostname>:9835"]
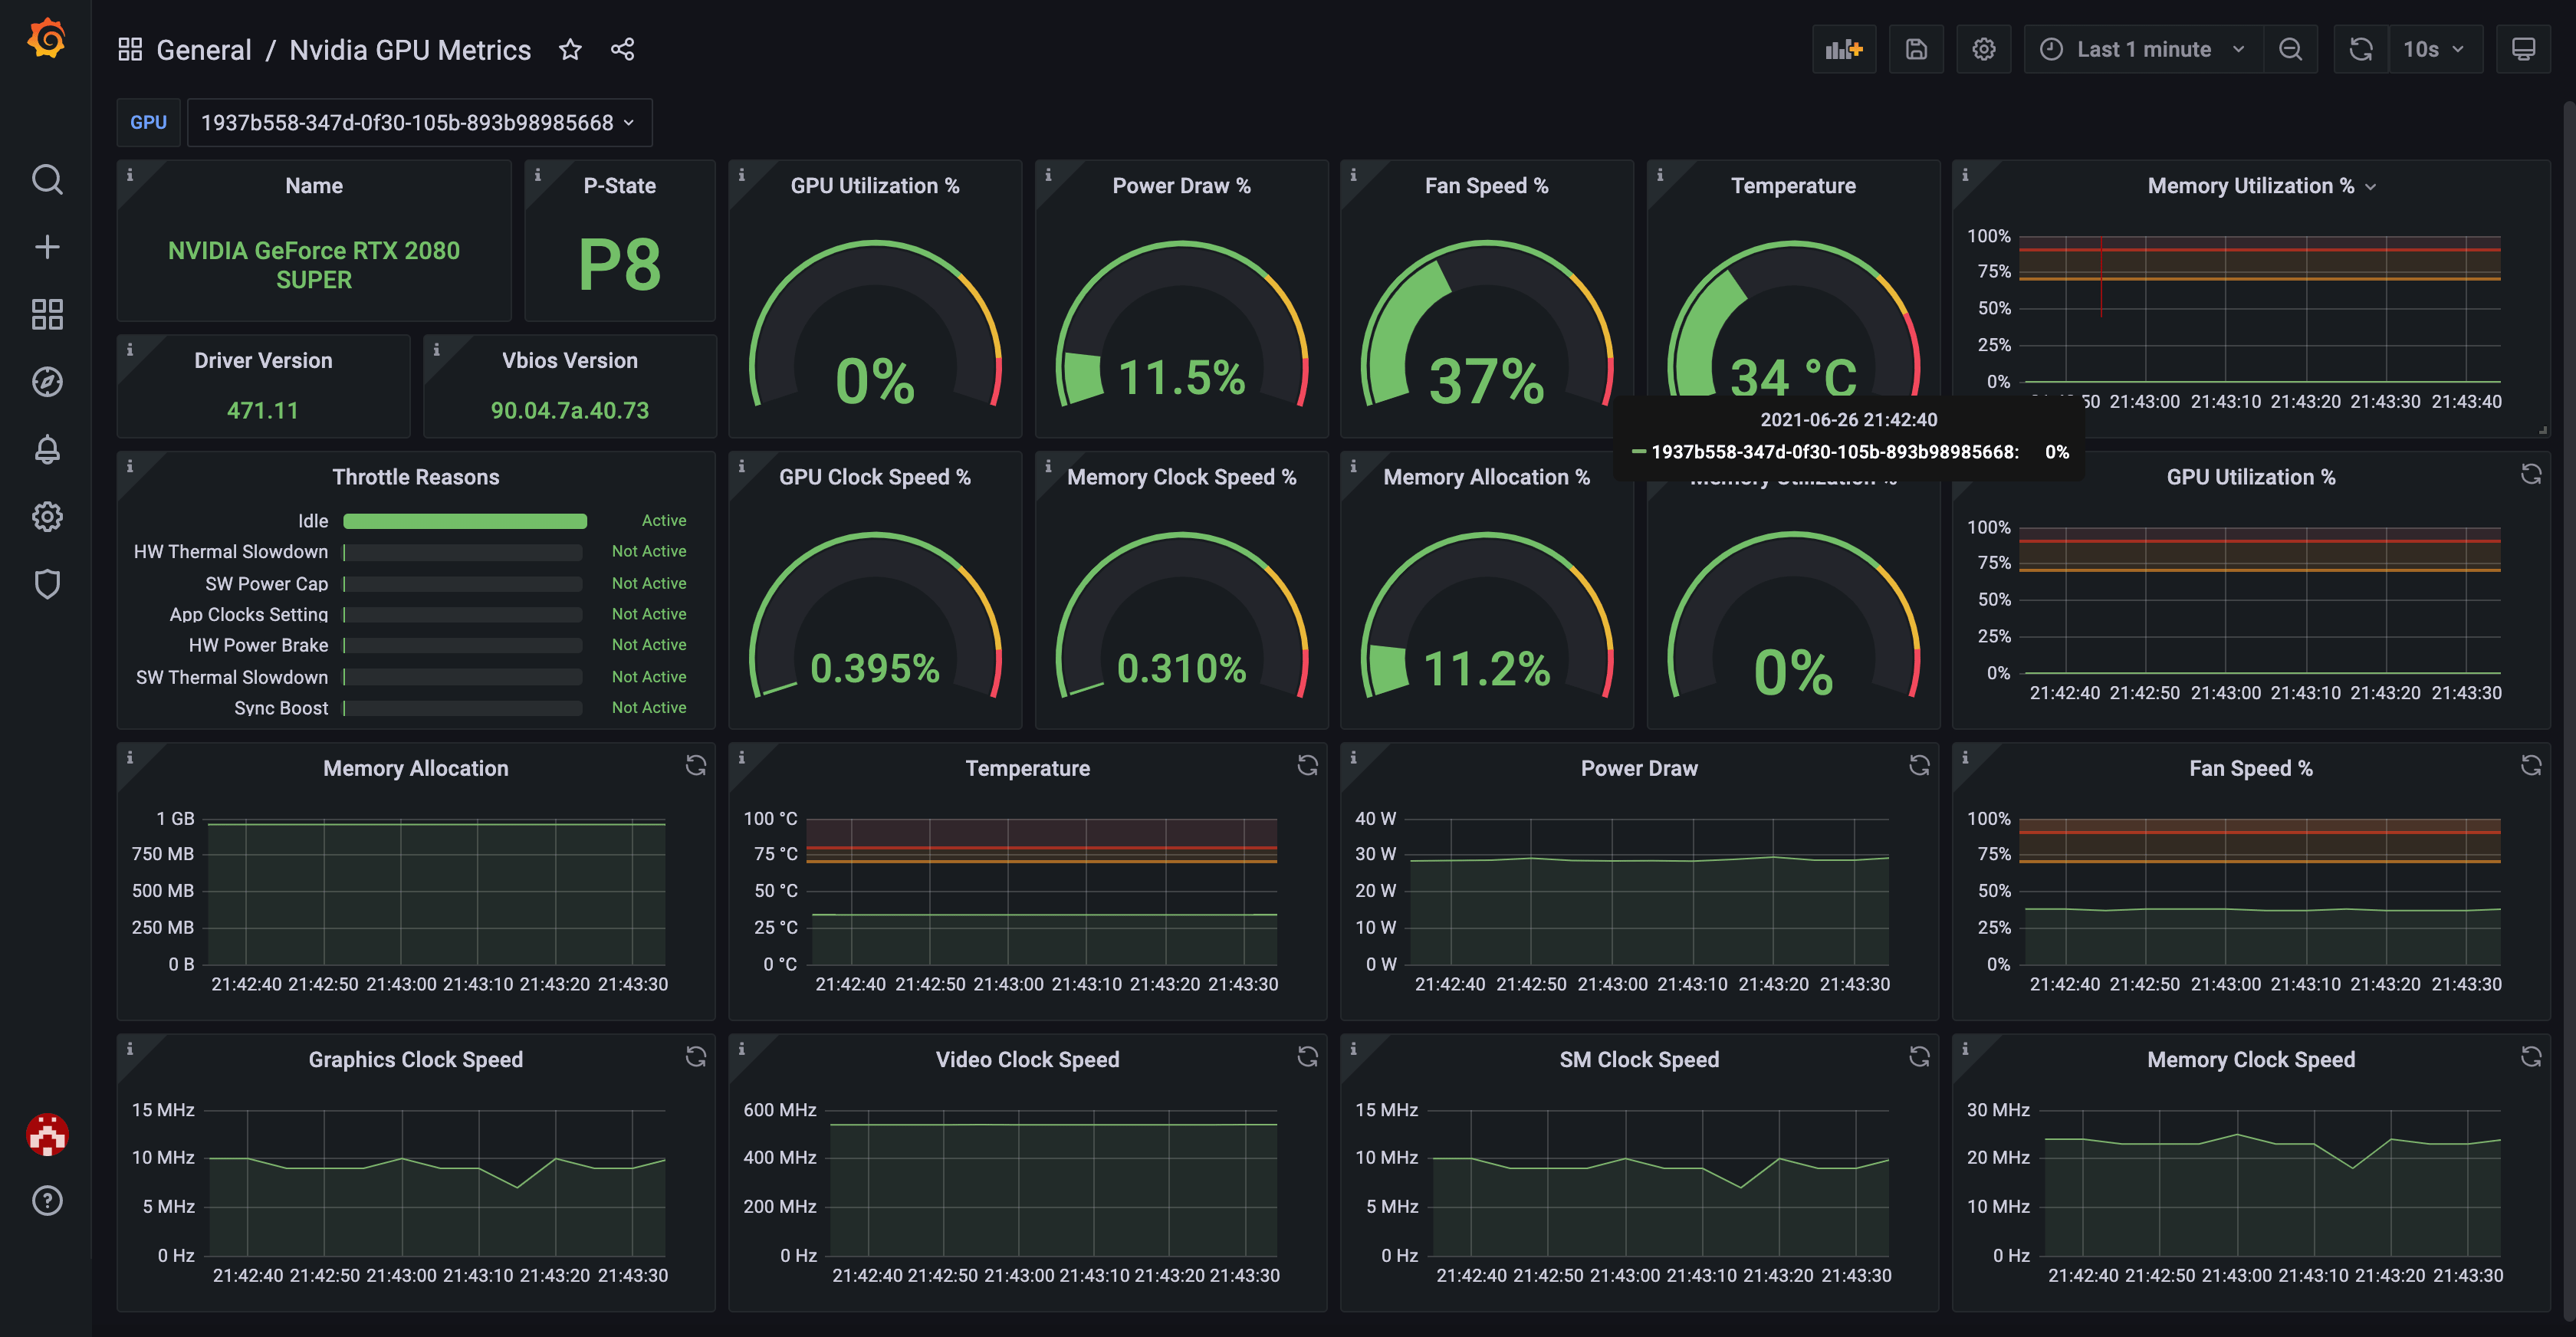
- Add the dashboard.json to your grafana instance.

Setup Windows Exporter
- Download the latest windows exporter binary - make sure it’s the
.msivariant, as this will install it as a service: windows_exporter/releases
Sample prometheus config:
 job_name: windows_exporter
    honor_timestamps: true
    scrape_interval: 15s
    scrape_timeout: 10s
    metrics_path: /metrics
    scheme: http
    follow_redirects: true
    static_configs:
      - targets: ["<your PC hostname>:9182"]
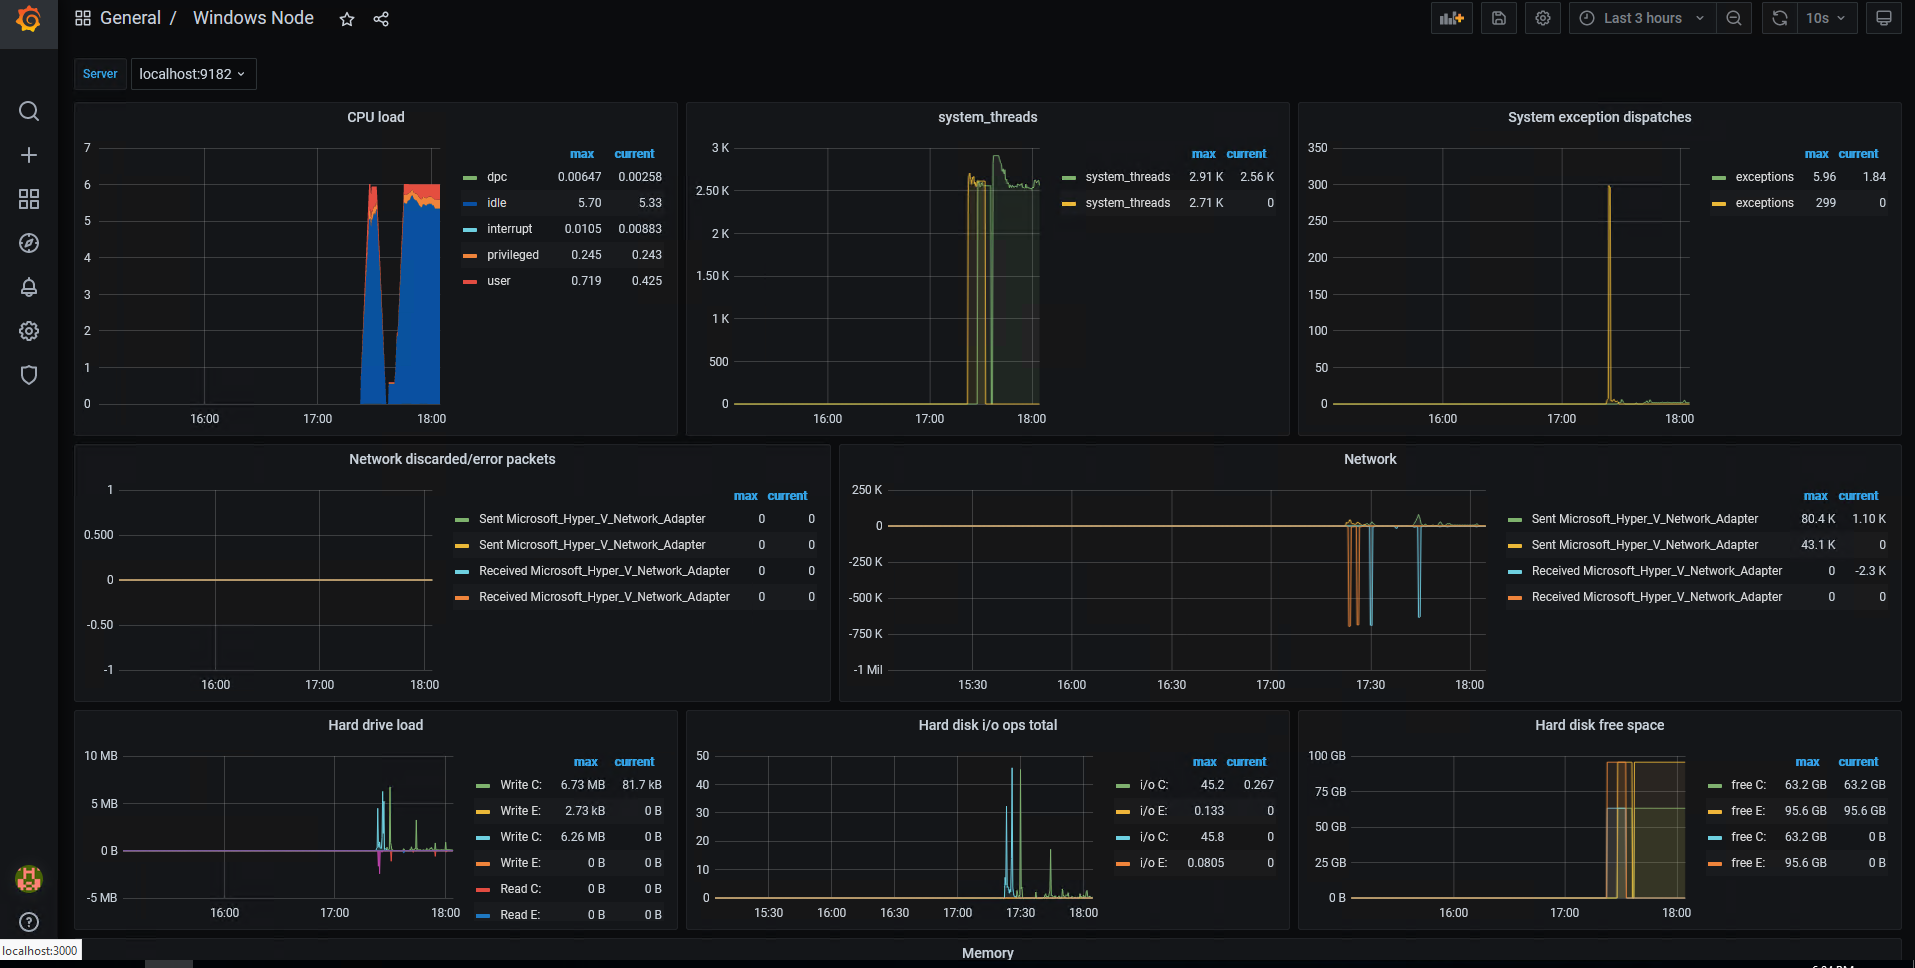
- Choose a Windows Exporter dashboard for grafana. Many exist for the windows_exporter, the one i’m currently using is here: Grafana ID: 14499
